CRM data cleanup automation sounds like a tidy back-office project until the CRM starts making revenue decisions from bad records.
Duplicate accounts inflate pipeline. Stale contacts waste campaign spend. Missing firmographics break segmentation. Bad owner and territory fields route leads to the wrong rep. Forecast calls turn into archaeology because nobody trusts the fields.
The question is not whether cleaner CRM data is good. Of course it is. The question is whether the next cleanup automation pilot has a measurable business case, a safe control model, and a payback period that can survive finance review.
Short answer
Use this CRM data cleanup automation ROI worksheet to estimate annual benefit from seven value levers: manual cleanup time saved, duplicate handling reduced, stale-contact waste avoided, enrichment gaps closed, routing errors prevented, campaign efficiency improved, and forecast rework reduced. Then subtract implementation and operating cost to calculate net benefit, ROI percentage, and payback period.
Red Brick Labs' point of view: do not justify CRM cleanup automation with a generic "bad data is expensive" slide. Pick one cleanup lane, baseline today's defect rates, model conservative value, and start with staged updates or human review before allowing automation to merge, overwrite, or reroute production CRM records.
Use this worksheet with the API integrations platform, best API integration partners for AI automation projects, best CRM data cleanup automation partners for revenue operations teams, and best ERP data sync automation partners for finance operations teams. If you need to pressure-test readiness first, use the CRM data cleanup automation readiness checklist. If you already have a business case, turn it into build scope with the CRM data cleanup automation requirements template.
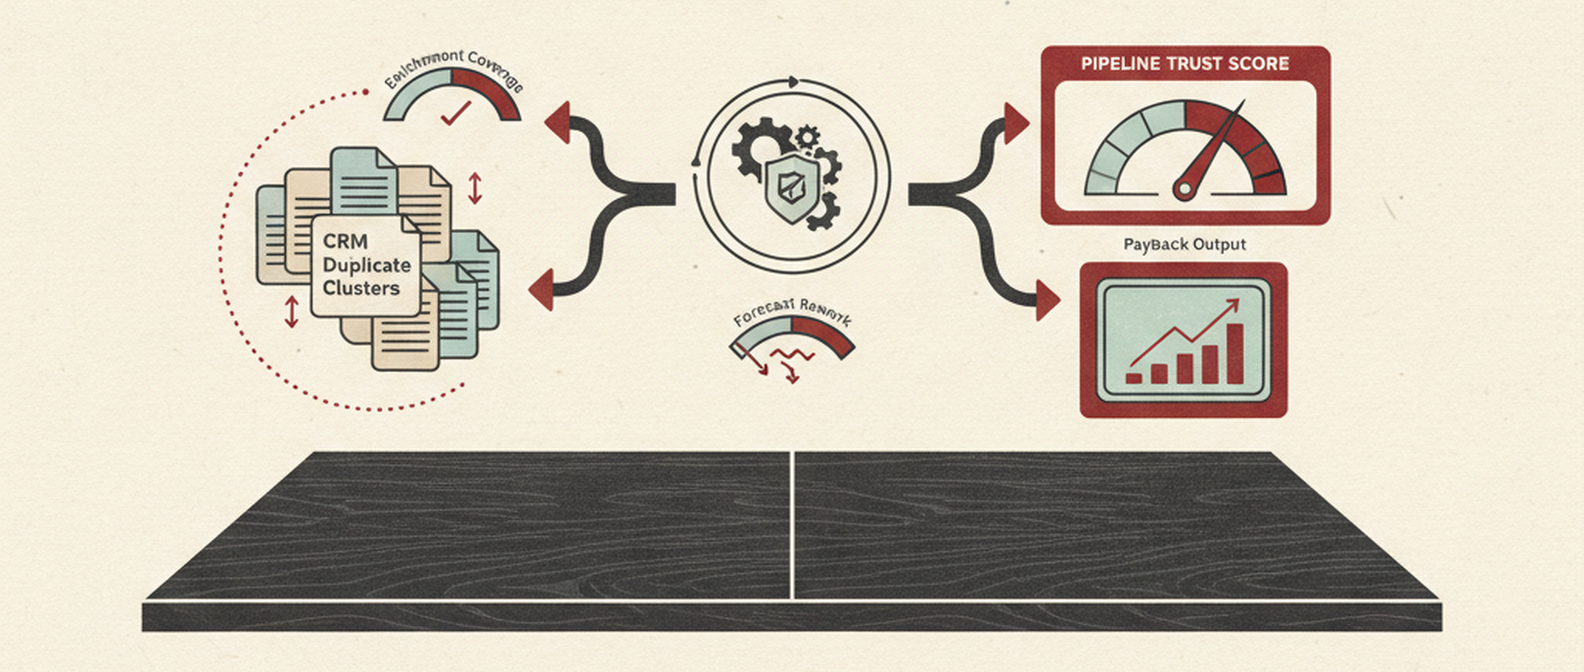
*Visual requirement: create the hero image at /blog/images/crm-data-cleanup-automation-roi-worksheet-for-revenue-operations-teams.png. Concept: a RevOps ROI calculator on a dark editorial desk, with duplicate CRM record clusters, enrichment coverage gauges, pipeline confidence, forecast rework, and payback output. No stock salespeople, no generic dashboard confetti, no fake AI robot.*
The CRM cleanup automation ROI formula
Start with one formula:
```text Annual net benefit = annual time savings + annual revenue recovered or protected + annual campaign waste avoided + annual reporting and forecast rework avoided
```
- annual operating cost
- one-time implementation cost
Then calculate:
```text ROI percentage = annual net benefit / total first-year cost
Payback months = total first-year cost / average monthly gross benefit ```
That is the finance version. The RevOps version is more useful:
``text CRM cleanup automation is worth piloting when: the cleanup lane is frequent + the defect is measurable + the business consequence is visible + the fix can be staged or reviewed + the first-year payback is believable without heroic assumptions ``
If the model only works after someone invents a huge conversion lift, the pilot is not ready. Start with read-only data profiling, exception queues, and source-system cleanup.
Worksheet tab 1: define the cleanup lane
"Clean the CRM" is not a project. It is a weather system.
Pick one lane narrow enough to measure:
| Cleanup lane | Good first pilot? | Why it matters |
|---|---|---|
| Duplicate company records created by imports | Yes | Affects account ownership, routing, reporting, and enrichment |
| Missing required fields on open opportunities | Yes | Affects forecasting, segmentation, handoff, and deal inspection |
| Lead-to-account match gaps for inbound leads | Yes | Affects routing speed, duplicate creation, and attribution |
| Stale contacts in nurture audiences | Yes | Affects email waste, bounce risk, and campaign reporting |
| All accounts, contacts, leads, opportunities, owners, territories, and consent fields | No | Too broad, too risky, and impossible to attribute |
Use this setup table before touching the ROI math:
| Field | Worksheet answer |
|---|---|
| CRM object in scope | |
| Segment or cohort | |
| Source creating the issue | |
| Business owner | |
| Systems owner | |
| Cleanup action | Detect, suggest, stage, enrich, normalize, merge, block, route, update |
| Automation boundary | Read-only, staged update, human approval, auto-write |
| Fields automation may never overwrite | |
| Rollback method | |
| Measurement window | Last 30, 60, or 90 days |
If you cannot fill that table, the ROI calculator will create fake precision.
Worksheet tab 2: baseline today's data quality
The ROI model needs defect rates, not opinions.
| Metric | Formula | Source |
|---|---|---|
| Record volume in scope | Count records in pilot cohort | CRM report |
| Duplicate rate | Duplicate candidates / records in scope | CRM duplicate report or data quality tool |
| Missing-field rate | Records missing required field / records in scope | CRM field completeness report |
| Stale-contact rate | Contacts with bounced, inactive, changed, or unverifiable status / contacts in scope | Email platform, enrichment provider, CRM activity |
| Invalid or risky email rate | Invalid, bounced, suppressed, or consent-risk contacts / contacts in audience | MAP or email platform |
| Lead-to-account match gap | Unmatched inbound leads / inbound leads | CRM, MAP, routing tool |
| Routing error rate | Misrouted leads or accounts / routed records | SLA tickets, owner correction logs, routing audit |
| Manual cleanup hours | Hours spent auditing, merging, enriching, fixing, reporting | Timesheet, calendar sample, RevOps estimate |
| Forecast rework hours | Hours spent reconciling CRM data before forecast calls | RevOps and sales leadership estimate |
For a quick first pass, sample the last 100 to 500 records in the target lane. For approval, use at least one full month and preserve the report links.
Worksheet tab 3: calculate manual time savings
Manual cleanup is the easiest value lever to prove. It is also the easiest to overstate.
Use loaded cost, not salary alone:
``text Loaded hourly cost = annual compensation x 1.25 to 1.4 / 2,080 ``
Then calculate:
``text Annual manual cleanup cost = weekly cleanup hours x loaded hourly cost x 52 ``
And:
``text Annual time savings = annual manual cleanup cost x automation coverage rate x quality acceptance rate ``
Example:
| Input | Example |
|---|---|
| RevOps cleanup hours per week | 8 |
| Loaded hourly cost | $85 |
| Automation coverage rate | 60% |
| Quality acceptance rate | 85% |
| Annual time savings | $30,056 |
The acceptance rate matters. If automation finds records but humans reject half the recommendations, the saved-time model should reflect that.
Worksheet tab 4: calculate duplicate handling value
Duplicate cleanup has two kinds of value:
- The direct time saved from finding, reviewing, and merging duplicates.
- The revenue-process value from preventing duplicate owners, duplicate outreach, bad account rollups, and inflated reporting.
Use this table:
| Input | Formula |
|---|---|
| Duplicate records in scope | Records in scope x duplicate rate |
| Manual minutes per duplicate case | Average review, research, merge, field survivorship, and child-object check time |
| Annual duplicate cases | Duplicate cases created per month x 12 |
| Time value | Annual cases x minutes per case / 60 x loaded hourly cost |
| Prevention value | Duplicate cases prevented x estimated downstream correction cost |
Keep the first model conservative. Automatic duplicate merging can create expensive mistakes when account hierarchy, ownership, open opportunities, contracts, invoices, or customer records are involved.
The safer first automation is usually:
- detect duplicate clusters;
- enrich the evidence packet;
- score confidence;
- stage the recommended master record and survivorship rules;
- route high-confidence, low-risk records for approval;
- block ambiguous or strategic-account cases from auto-merge.
Worksheet tab 5: calculate enrichment and match-rate value
Enrichment ROI is not "more fields good." It should tie to one operational outcome:
- better routing;
- better segmentation;
- better account scoring;
- better lead-to-account matching;
- less rep research;
- fewer records sent to the wrong campaign or sequence.
Use this model:
``text Annual enrichment value = records improved per year x minutes saved or value gained per improved record x acceptance rate ``
For routing or conversion impact:
``text Annual revenue recovery = affected leads per year x improvement in correct routing rate x lead-to-opportunity conversion rate x opportunity win rate x average contract value x attribution confidence factor ``
The attribution confidence factor keeps the model honest. If cleaner data is one of many things helping conversion, do not credit the whole revenue lift to cleanup automation. Use 10% to 30% unless the pilot is isolated enough to prove more.
Worksheet tab 6: calculate campaign waste avoided
Bad CRM data wastes marketing spend quietly. Stale contacts, invalid emails, duplicate records, bad lifecycle stages, and missing segments all distort campaign performance.
Use this simple model:
``text Annual campaign waste avoided = annual campaign spend touching affected audience x bad-data audience rate x avoidable waste rate ``
Example:
| Input | Example |
|---|---|
| Annual campaign spend touching affected CRM audience | $180,000 |
| Bad-data audience rate | 18% |
| Avoidable waste rate | 35% |
| Annual campaign waste avoided | $11,340 |
Do not count all bad-data audience spend as wasted. Some contacts may still be useful, some campaigns may have suppression logic, and some waste is not recoverable through CRM cleanup alone.
Worksheet tab 7: calculate forecast and reporting rework avoided
Revenue leaders do not only pay for CRM data quality through direct cleanup time. They pay through forecast calls, board reporting, territory disputes, pipeline hygiene meetings, manual exports, and analysis nobody trusts.
Use:
``text Annual forecast rework avoided = monthly rework hours x loaded hourly cost of participants x 12 x automation reduction rate ``
Include only recurring rework tied to the cleanup lane. If the pilot is duplicate account cleanup, count account-rollup, owner, territory, attribution, and duplicate pipeline rework. Do not count every annoying forecast debate in the company.
Worksheet tab 8: calculate implementation and operating cost
The cost side needs to be just as specific as the benefit side.
| Cost | Include |
|---|---|
| Discovery and baseline | Reports, source-system map, sample review, current-state workflow |
| Automation build | CRM API work, matching logic, enrichment rules, staging fields, review queue, audit logs |
| Tooling or vendor cost | Data quality platform, enrichment credits, iPaaS, warehouse, custom app, monitoring |
| Change management | Admin training, reviewer training, field policy changes, sales manager rollout |
| QA and rollback | Sampling, false-positive review, rollback script, audit checks |
| Ongoing operations | Weekly queue review, monthly metrics, exception handling, vendor monitoring |
Formula:
``text Total first-year cost = one-time implementation cost + annual software and data cost + annual operating labor cost ``
If the workflow touches strategic accounts, customers, ownership, territory, consent, billing, legal, or open opportunities, add QA cost. The cost is real. It is also cheaper than a confident automation writing bad data at scale.
The spreadsheet-ready ROI worksheet
Copy this table into a spreadsheet. Replace examples with your own values.
| Section | Input | Example | Your value |
|---|---|---|---|
| Scope | Records in pilot cohort | 50,000 | |
| Scope | Monthly new or changed records | 4,000 | |
| Baseline | Duplicate rate | 8% | |
| Baseline | Missing-field rate | 22% | |
| Baseline | Stale or invalid contact rate | 18% | |
| Baseline | Routing error rate | 4% | |
| Time | Weekly manual cleanup hours | 8 | |
| Time | Loaded hourly cost | $85 | |
| Time | Automation coverage rate | 60% | |
| Time | Quality acceptance rate | 85% | |
| Duplicate value | Monthly duplicate cases reviewed | 180 | |
| Duplicate value | Manual minutes per duplicate case | 12 | |
| Duplicate value | Duplicate cases prevented or accelerated | 65% | |
| Enrichment value | Records improved per year | 18,000 | |
| Enrichment value | Minutes saved per improved record | 1.5 | |
| Routing value | Affected leads per year | 12,000 | |
| Routing value | Correct-routing improvement | 1.5% | |
| Routing value | Lead-to-opportunity conversion rate | 8% | |
| Routing value | Opportunity win rate | 22% | |
| Routing value | Average contract value | $18,000 | |
| Routing value | Attribution confidence factor | 20% | |
| Campaign value | Annual campaign spend touching affected audience | $180,000 | |
| Campaign value | Bad-data audience rate | 18% | |
| Campaign value | Avoidable waste rate | 35% | |
| Forecast value | Monthly forecast/reporting rework hours | 14 | |
| Forecast value | Loaded hourly cost of participants | $120 | |
| Forecast value | Automation reduction rate | 35% | |
| Cost | One-time implementation cost | $45,000 | |
| Cost | Annual software/data cost | $18,000 | |
| Cost | Annual operating labor cost | $12,000 |
Now calculate the outputs:
| Output | Formula |
|---|---|
| Annual manual time savings | Weekly cleanup hours x loaded hourly cost x 52 x automation coverage x quality acceptance |
| Annual duplicate handling savings | Monthly duplicate cases x minutes per case / 60 x loaded hourly cost x 12 x prevention or acceleration rate |
| Annual enrichment time savings | Records improved per year x minutes saved per record / 60 x loaded hourly cost |
| Annual routing revenue recovery | Affected leads x correct-routing improvement x lead-to-opportunity rate x win rate x ACV x attribution confidence |
| Annual campaign waste avoided | Campaign spend x bad-data audience rate x avoidable waste rate |
| Annual forecast rework avoided | Monthly rework hours x participant loaded hourly cost x 12 x automation reduction rate |
| Gross annual benefit | Sum of all annual benefit lines |
| First-year cost | Implementation cost + annual software/data cost + annual operating labor cost |
| First-year net benefit | Gross annual benefit - first-year cost |
| ROI percentage | First-year net benefit / first-year cost |
| Payback months | First-year cost / (gross annual benefit / 12) |
*Visual requirement: create a calculator preview at /blog/images/crm-data-cleanup-automation-roi-worksheet-for-revenue-operations-teams-calculator-preview.png showing worksheet tabs for Scope, Baseline, Time Savings, Revenue Recovery, Campaign Waste, Cost, and Payback. Keep numbers readable at blog width.*
Example ROI calculation
Here is a conservative example for a RevOps team with 50,000 records in the target cohort.
| Benefit line | Annual value |
|---|---|
| Manual cleanup time saved | $30,056 |
| Duplicate handling accelerated | $9,282 |
| Enrichment research time saved | $38,250 |
| Routing revenue recovery | $12,830 |
| Campaign waste avoided | $11,340 |
| Forecast and reporting rework avoided | $7,056 |
| Gross annual benefit | $108,814 |
| First-year cost | $75,000 |
| First-year net benefit | $33,814 |
| First-year ROI | 45% |
| Payback period | 8.3 months |
That is a pilot worth discussing. It does not require pretending cleanup automation will magically transform the whole revenue engine. It shows where the value comes from, where the assumptions are soft, and which metrics the pilot needs to prove.
What to automate first
The highest-ROI first lane is usually not "merge every duplicate."
Better first lanes:
| First lane | Why it is safer | ROI driver |
|---|---|---|
| Read-only data quality audit | No production writes | Baseline, prioritization, duplicate and missing-field visibility |
| Duplicate evidence packets | Human approves final merge | Review time saved, fewer false positives |
| Enrichment staging fields | Production fields protected | Research time saved, better routing and segmentation |
| Lead-to-account match review queue | Prevents bad routing before assignment | Faster routing, less owner correction |
| Field normalization for low-risk picklists | Deterministic and reversible | Reporting cleanup, segmentation reliability |
| Data quality monitoring and alerts | Prevents new defects | Less recurring cleanup and fewer campaign surprises |
Do not start with high-risk writebacks unless the readiness score is strong. Ownership, territory, lifecycle, consent, customer status, billing, and strategic-account fields deserve extra friction.
Controls the ROI model should require
Every credible ROI worksheet needs a control section. Otherwise the business case rewards reckless automation.
Minimum controls:
- source-system map;
- field ownership matrix;
- duplicate match policy;
- master record and survivorship rules;
- enrichment overwrite policy;
- staging fields for suggested changes;
- human review for ambiguous or high-impact cases;
- audit log for every recommended and accepted change;
- rollback method;
- weekly QA sample;
- duplicate, missing-field, enrichment, and routing trend dashboard.
The first automation should make RevOps more confident, not merely faster at making permanent mistakes.
Red Brick Labs POV
CRM data cleanup automation has a better business case when it is treated as revenue infrastructure, not admin hygiene.
The fastest path is usually:
- Pick one painful cleanup lane.
- Build a baseline from CRM reports, duplicate jobs, enrichment coverage, routing audits, campaign data, and RevOps time estimates.
- Model conservative value across time, campaign waste, routing, enrichment, and forecast rework.
- Start with read-only detection, evidence packets, and staged updates.
- Add automatic writebacks only after confidence thresholds, rollback, monitoring, and ownership are proven.
Red Brick Labs would not begin by promising a pristine CRM. We would begin by finding the cleanup lane with the clearest economic signal and the least dangerous write path. Then we would ship the smallest production automation that saves time, protects revenue workflows, and leaves RevOps with a system they can operate.
CTA: turn the worksheet into a controlled pilot
If your RevOps team knows the CRM is messy but cannot get budget for cleanup automation, Red Brick Labs can help turn the pain into a finance-ready pilot.
We map the data quality problem, baseline the defect rates, build the ROI model, define the controls, and ship the first cleanup automation around your existing CRM, enrichment tools, marketing automation, warehouse, and routing logic.
Calculate the ROI of CRM cleanup automation: Red Brick Labs can help your RevOps team baseline CRM data quality, model the ROI, choose the safest first cleanup lane, and ship a controlled automation pilot around the CRM and GTM systems you already use.
Book a 15-minute consultation if you want help calculating the ROI of CRM cleanup automation and choosing the safest first workflow to automate.
Visual and asset requirements
- Hero image:
blog/images/crm-data-cleanup-automation-roi-worksheet-for-revenue-operations-teams.png, dark editorial RevOps ROI calculator with CRM record clusters, enrichment gauges, routing arrows, forecast trust score, and payback output. - Calculator preview visual:
blog/images/crm-data-cleanup-automation-roi-worksheet-for-revenue-operations-teams-calculator-preview.png, spreadsheet-style preview of inputs, formulas, and outputs. - ROI waterfall visual:
blog/images/crm-data-cleanup-automation-roi-worksheet-for-revenue-operations-teams-roi-waterfall.png, showing annual value from time saved, duplicate handling, enrichment, routing, campaign waste, and forecast rework minus implementation cost. - Summary table: included in the spreadsheet-ready ROI worksheet and example calculation sections.
- Screenshots or template preview visuals: use template preview visuals rather than third-party screenshots because this article is a calculator asset, not a named-vendor comparison.
- Alt text: "CRM data cleanup automation ROI worksheet for revenue operations teams".
Source notes
Sources reviewed on June 25, 2026:
- Gartner: Data Quality Best Practices - supports the claim that poor data quality has large organizational cost and that inconsistency across sources is a major data quality challenge.
- IBM: The True Cost of Poor Data Quality - supports the downstream-cost framing, including lost revenue, inefficiencies, compliance risk, and missed opportunities.
- Salesforce Data Quality PDF, Spring 2026 - supports duplicate management, matching rules, duplicate jobs, alerts, blocking, duplicate sets, reports, and progress tracking as native Salesforce data quality concepts.
- HubSpot Knowledge Base: Use data quality tools - supports HubSpot data quality workflows around duplicate management, formatting issues, enrichment coverage, property insights, alerts, and weekly data quality digest.
- HubSpot Database Decay Simulation - supports the 22.5% annual database decay reference from MarketingSherpa research cited by HubSpot.
- Openprise: CRM data hygiene benchmarking for RevOps - supports the four-dimension CRM data hygiene model: completeness, accuracy, recency, and normalization. Also supports the 2025 State of RevOps Survey finding that 99% of respondents struggled with at least one dimension of technical data quality.
- Validity: What is Data Quality Monitoring? - supports the argument that CRM data quality monitoring is continuous, not a one-time cleanup.
- AskElephant: How RevOps Teams Keep CRM Data Clean - supports weekly hygiene checks, monthly audits, proactive alerts, and the warning that one-time cleanup fails if teams do not fix why data gets dirty.
Related reading
- API Integrations Platform
- Best API Integration Partners for AI Automation Projects
- Best CRM Data Cleanup Automation Partners for Revenue Operations Teams
- CRM Data Cleanup Automation Readiness Checklist for Revenue Operations Teams
- CRM Data Cleanup Automation Requirements Template for Revenue Operations Teams
- Best ERP Data Sync Automation Partners for Finance Operations Teams